Giuliano Biasci Giuliano Biasci - 8 Aprile, 2021 - 7 ’ read

Call Analytics: 2 new reports to make devices’ adoption effective.

Since the pandemic revolutionized our work practices and physical phones are increasingly giving way to virtual devices, companies need analysis tools to make data-driven decisions and understand where costs can be cut. Starting from Spring '21, Imagicle Call Analytics provides two new reports to monitor device usage and adoption patterns across your organization, and today I will show you their potential.

Included in Imagicle Call Analytics – Spring Release 2021 – with no additional cost (you just need to have an active ImagicleCare contract on your subscription plan!), these reports are available for all customers using Cisco UCM, even on-prem. Thanks to our dedicated tool for Cisco, in fact, it will be possible to analyze the activities of all users, including those who have not yet connected their UCM to the cloud. Yes, guys, it’s Imagicle!

Learn from data with two brand-new reports.
Once we had identified the key information, forming the foundation on which the new reports would be built, we looked at the most effective way to extract all the data. In order to be able to carry out a comprehensive survey about the company’s device usage, we decided to separate the analysis into two phases, which resulted in two reports. 
  1. Device Models Adoption Report, representing how devices are being used over a specific time window and providing valuable insights on how device models are distributed and used across your company in terms of active users and devices, call traffic, and idle devices; while also comparing the use of traditional and virtual phones.
  2. Device Usage trends, an analysis of the variation in usage over time, offering crucial information on the adoption of virtual devices in comparison with physical ones.
Both reports were structured in 3 sections:
  • KPI: it collects some key data that immediately gives an idea of the situation and draws the user’s attention to obvious criticalities;
  • Graphical data: shows data of particular interest that cannot be summarised in a single value, but helps the user identify crucial information if expressed in graphical form;
  • Table data: this section contains the raw data in tabular form on which detailed investigations can be carried out.
And now the key question: what will your data teach you?
Let’s take a glimpse at the contents of the individual reports.

Device Models Adoption report.

Understanding how your devices are being used is the best way to optimize resources, cut costs, and make decisions that could change your business outcomes for the better. The purpose of this report, in fact, is to provide an overview of the use of telephone devices in the company in a given time window, thus allowing to see if the device adoption is effective and consequentially reduce avoidable costs and increase productivity.
 
The report allows you to see handled calls, user’s activity, and active/idle devices. Plus, you can look into the details with a dedicated list and a breakdown per user for each device (flagged for physical and virtual devices). 
Here’s an overview: 
Device Model Adoption
 

Call Analytics: 2 new reports to make devices' adoption effective.
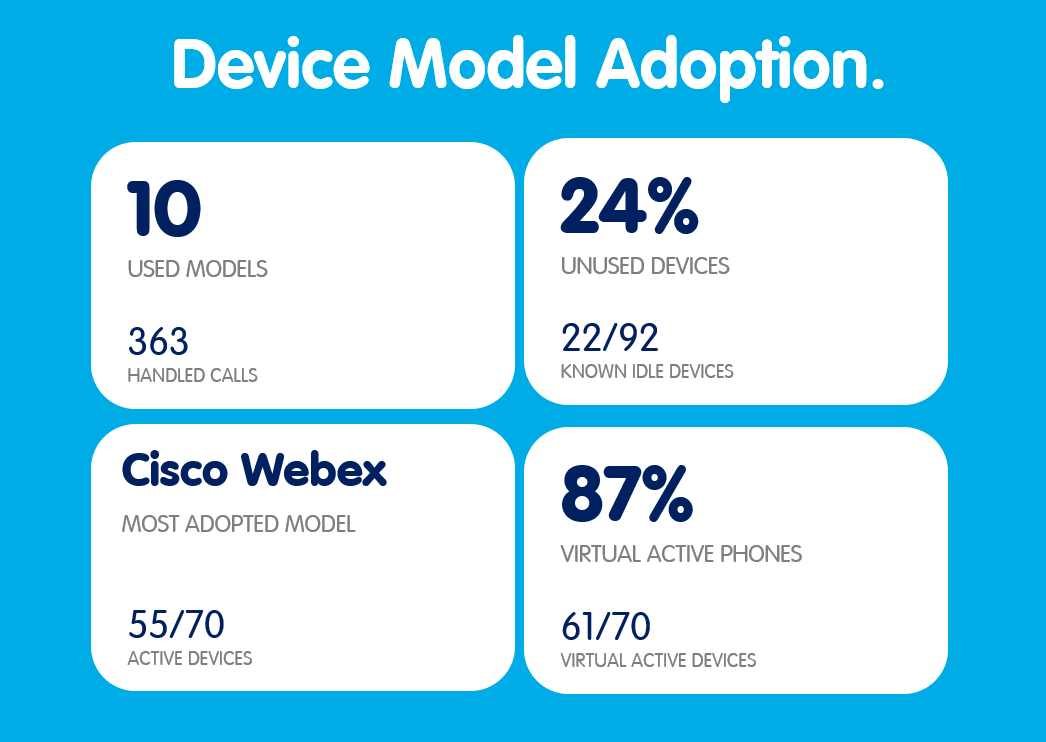
Used models:
it tells you the number of phone models used to make at least one call during the survey period and the total number of calls handled by all phones, to get a general idea of how many phones are being used across the company and how;


Call Analytics: 2 new reports to make devices' adoption effective.Unused devices: the number of devices that were never used in the survey period. This value is expressed both as a percentage of the total number of devices and as an absolute number, and it’s useful to track the actual adoption of each model. Could it be time to cut costs and optimize resources by getting rid of some unused devices?
 
 
Call Analytics: 2 new reports to make devices' adoption effective.Most adopted model: the highest number of active devices in the survey period compared with the total number of devices for a given phone model. Knowing what phone model is the most used among employees can really simplify core decision about the work tools to adopt in the company. Which model are your most active operators using?


Call Analytics: 2 new reports to make devices' adoption effective.Virtual active phones: the percentage of virtual phones out of the total number of active phones in the survey period. Do employees prefer softphones or physical phones? How does the rapid shift to smart working affect that preference? Which type leads to higher productivity, especially if your organization is migrating to a home-office model?
 
 
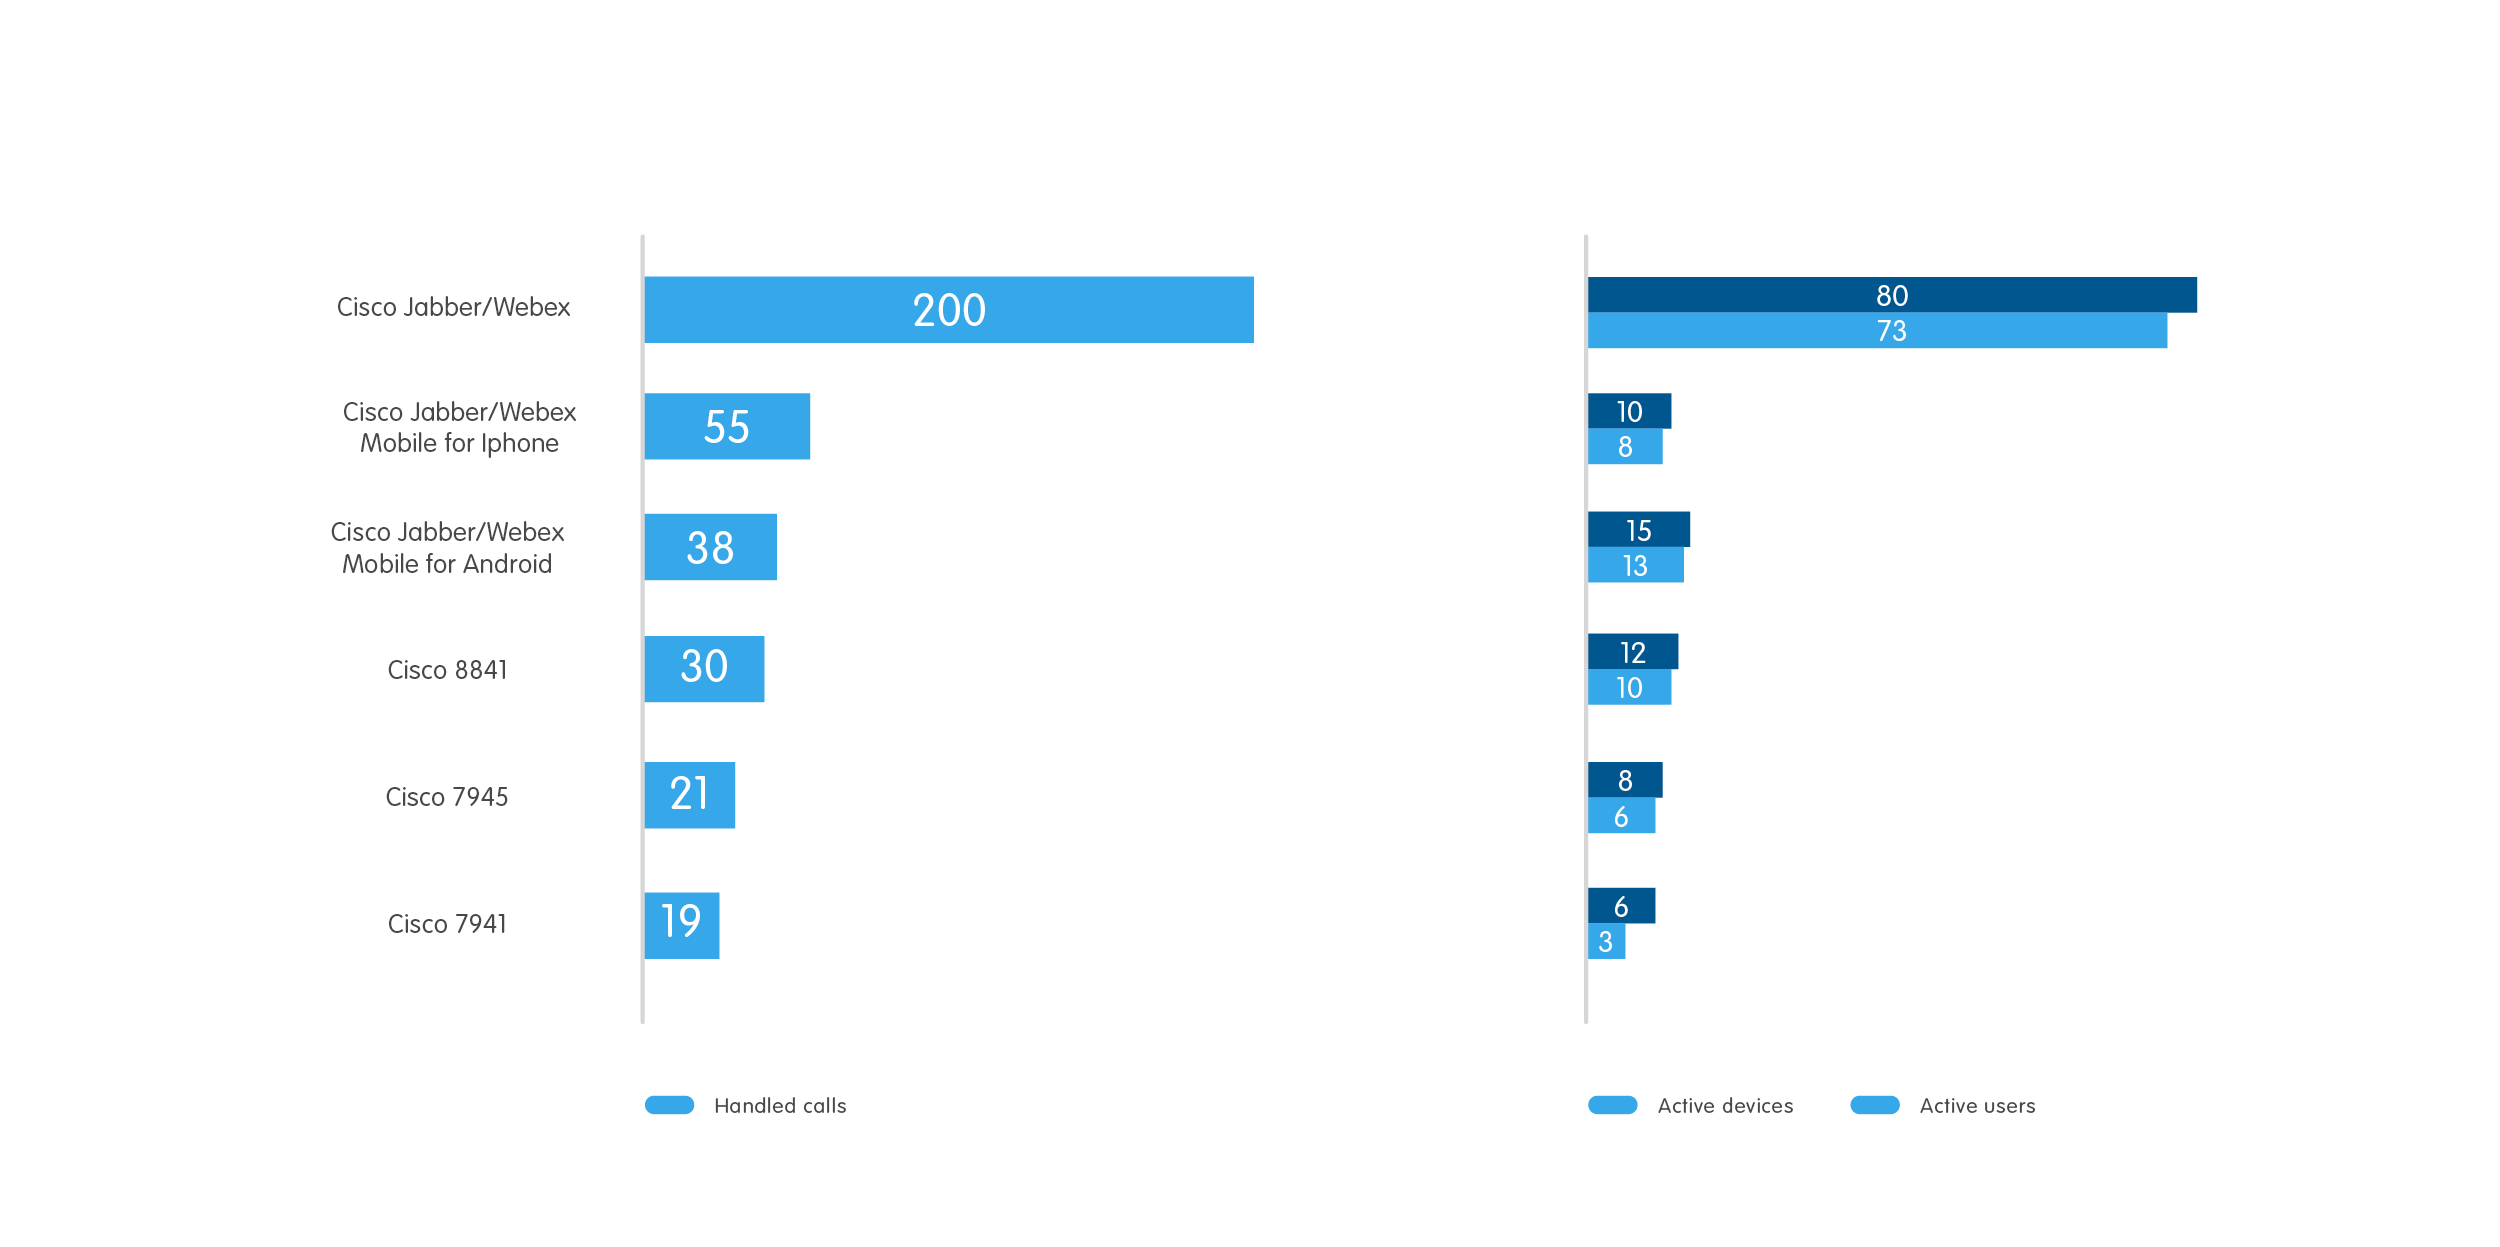
The graphs section of the report shows the ranking of the 10 models that handled most calls. For each of them 3 pieces of data are shown divided into two histograms. The first histogram shows the number of calls handled, while the second shows the number of active users and devices.
Models Adoption

Device Usage Trend report.

This report aims to represent the trend of device usage over time to understand which models are destined to fall into disuse and which are gaining popularity among users, while also checking if the trends are in line with company policies. It provides valuable insight on how device models are distributed and used across your company in terms of active users and devices, call traffic, and idle devices while comparing the use of virtual and physical phones.
The survey time window is divided into monthly slots, and a snapshot of the data is taken for each one of them.
Here’s an overview: 
Device Usage Trends
 
Call Analytics: 2 new reports to make devices' adoption effective.
Used models:
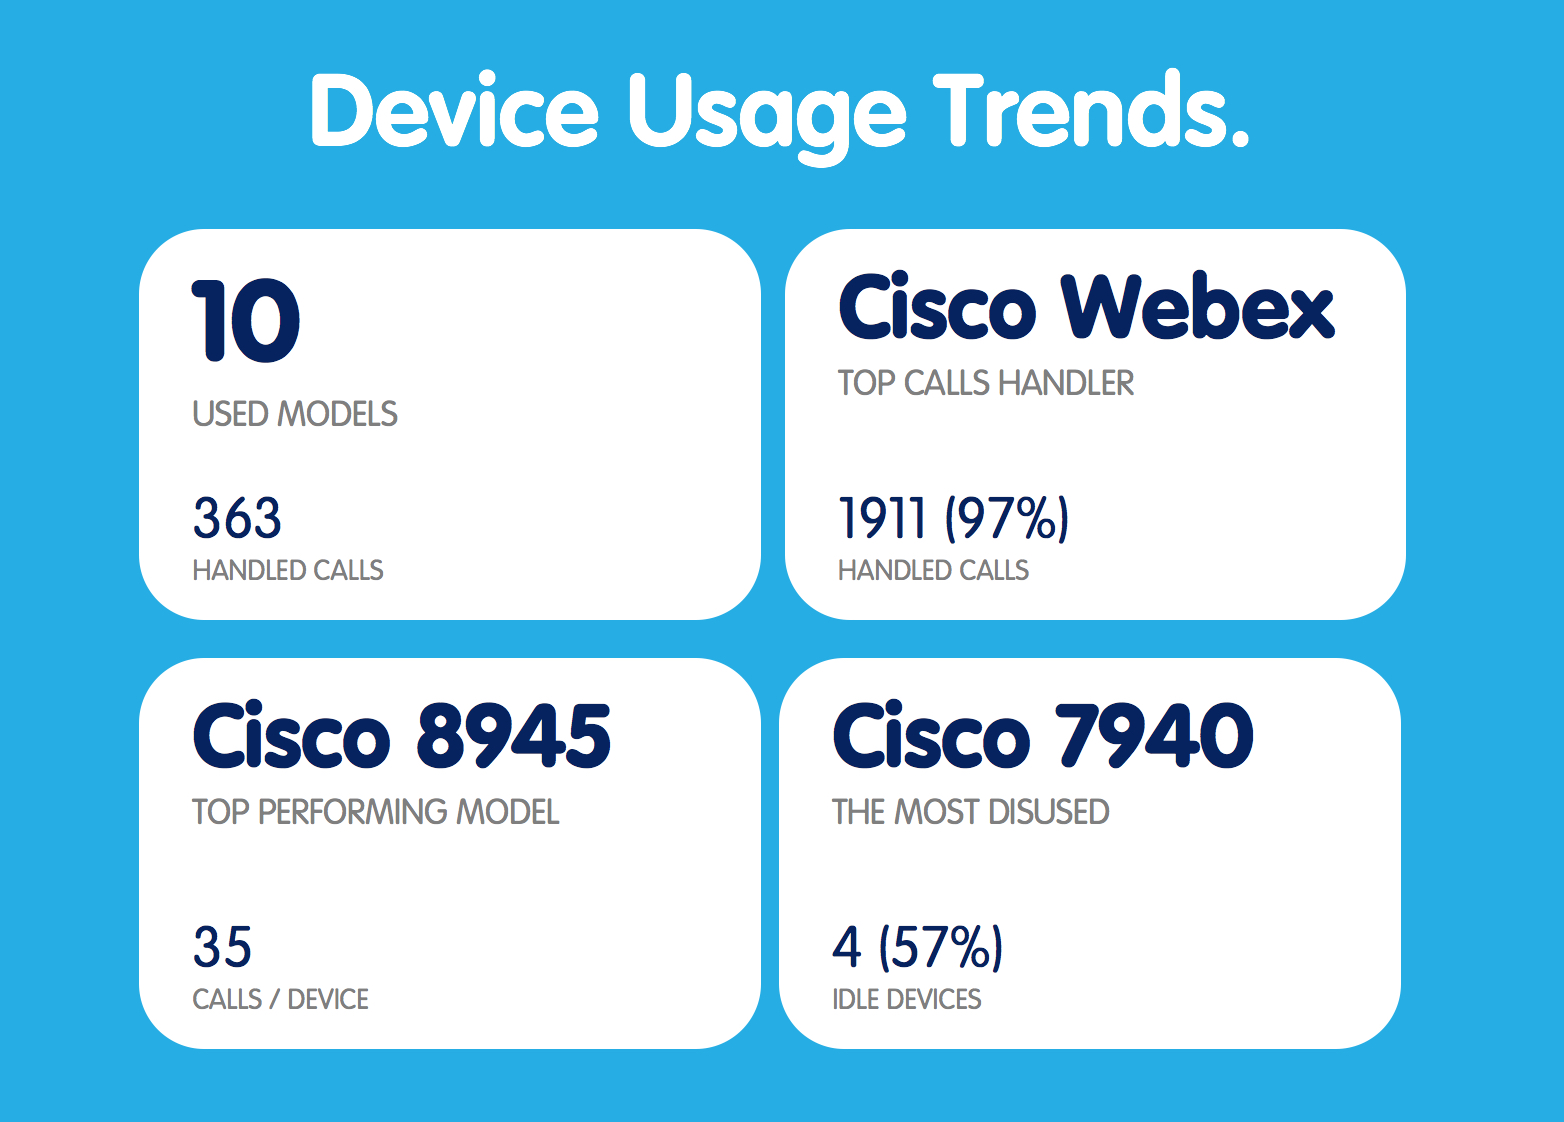
it coincides with the first KPI of the previous report (number of phone models used to make at least one call during the survey period). It’s listed here, too, for context.


Call Analytics: 2 new reports to make devices' adoption effective. Top calls handler: it’s the phone model that handled most calls during the survey period. It tells you the number of calls handled by the model in question and the percentage they represent in the total number of calls handled in a specific time window. Is it the one you expected or were you on the wrong track?
 
 
Call Analytics: 2 new reports to make devices' adoption effective.Top performing model: it’s the phone model with the highest average number of calls handled per device. It tells you the average number of calls handled by the analyzed model in a specific time window. Detecting the most effective model is crucial to correctly allocate resources: are the most active users working with the phone that suits them best?
 
 
Call Analytics: 2 new reports to make devices' adoption effective.The most disused: it’s the active phone model with the highest number of unused devices. It tells you the percentage of inactive devices out of the total number of devices for the analyzed model. Is it time to get rid of an old model or do you have a problem with the adoption of a new device? 


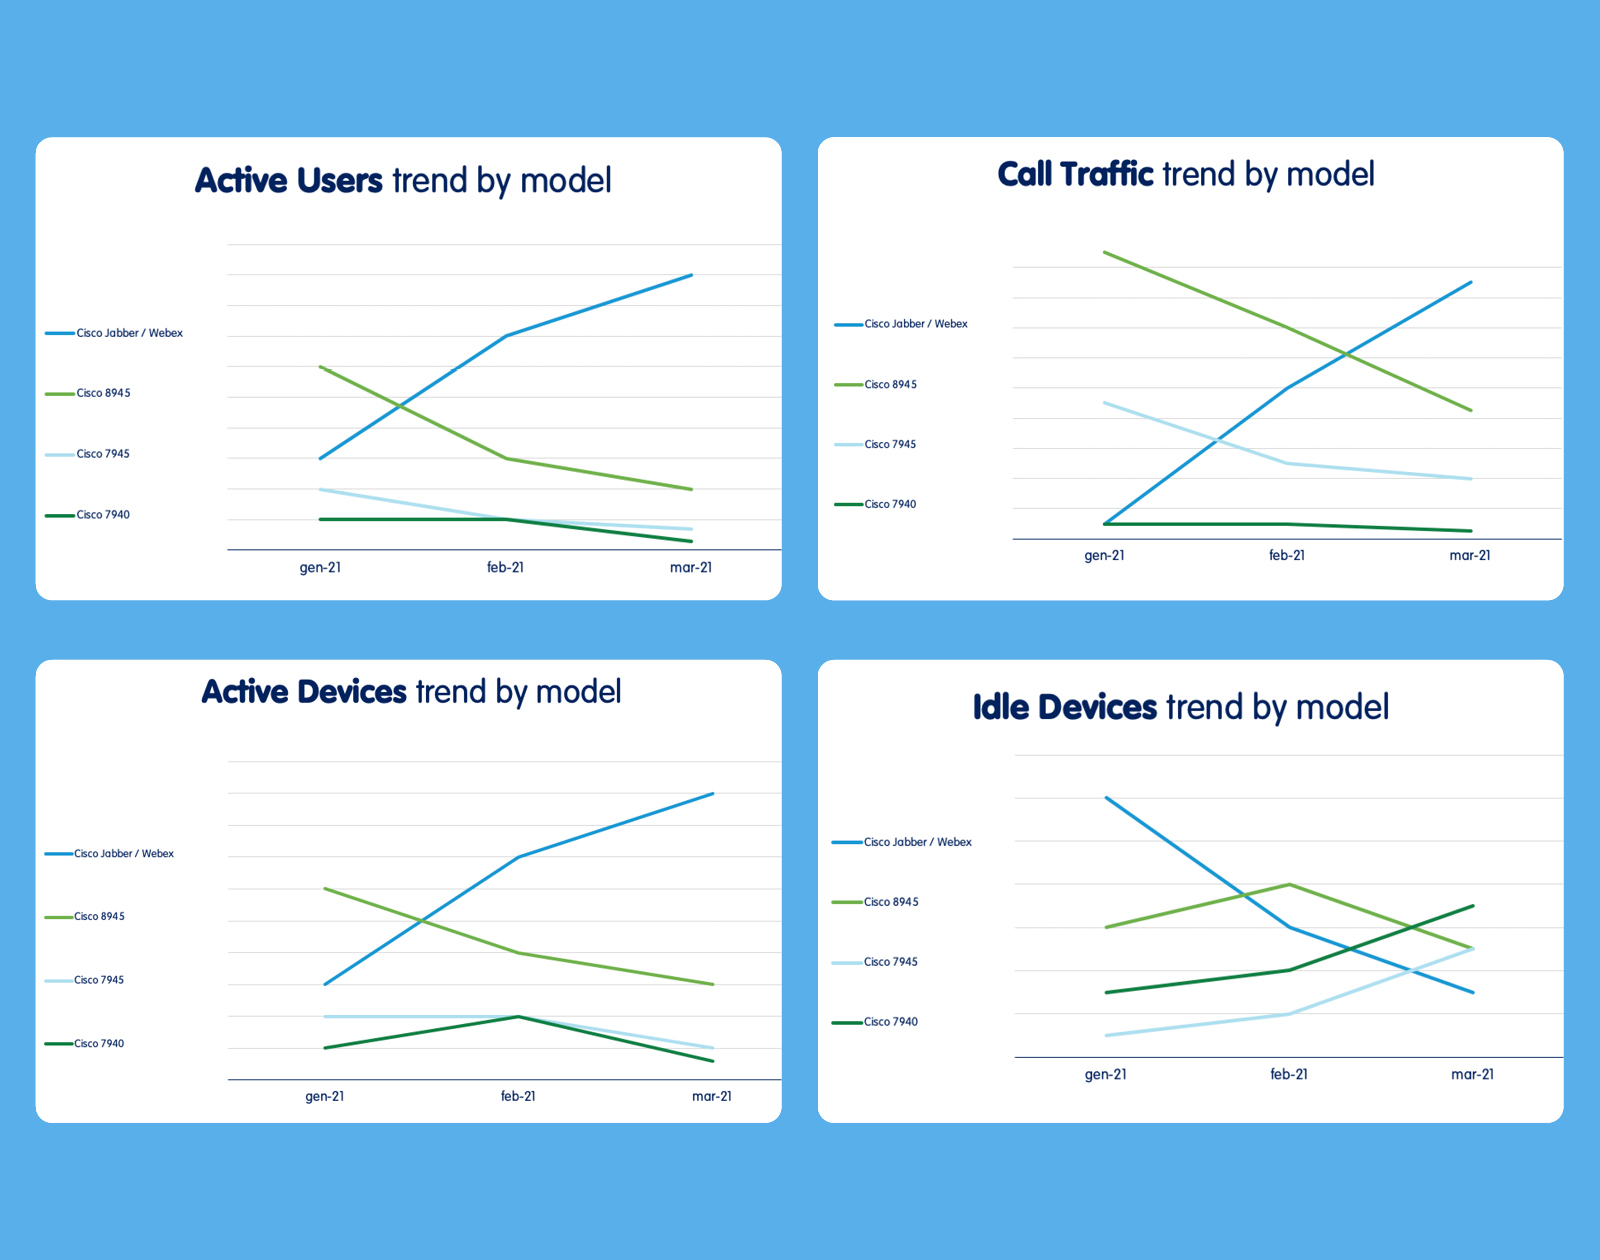
The graphs in this report are timelines divided by month summarizing the trend for the following information:
 
  • Active users / Call traffic per model, to see how the usage changes over time and which models lead to the highest productivity;
  • Active devices per model, to see if the usage of a model is the one you expected, how it’s performing, and if and how employees are using it;
  • Idle devices per model, to understand if trends are in line with your device policy;
Usage graphics
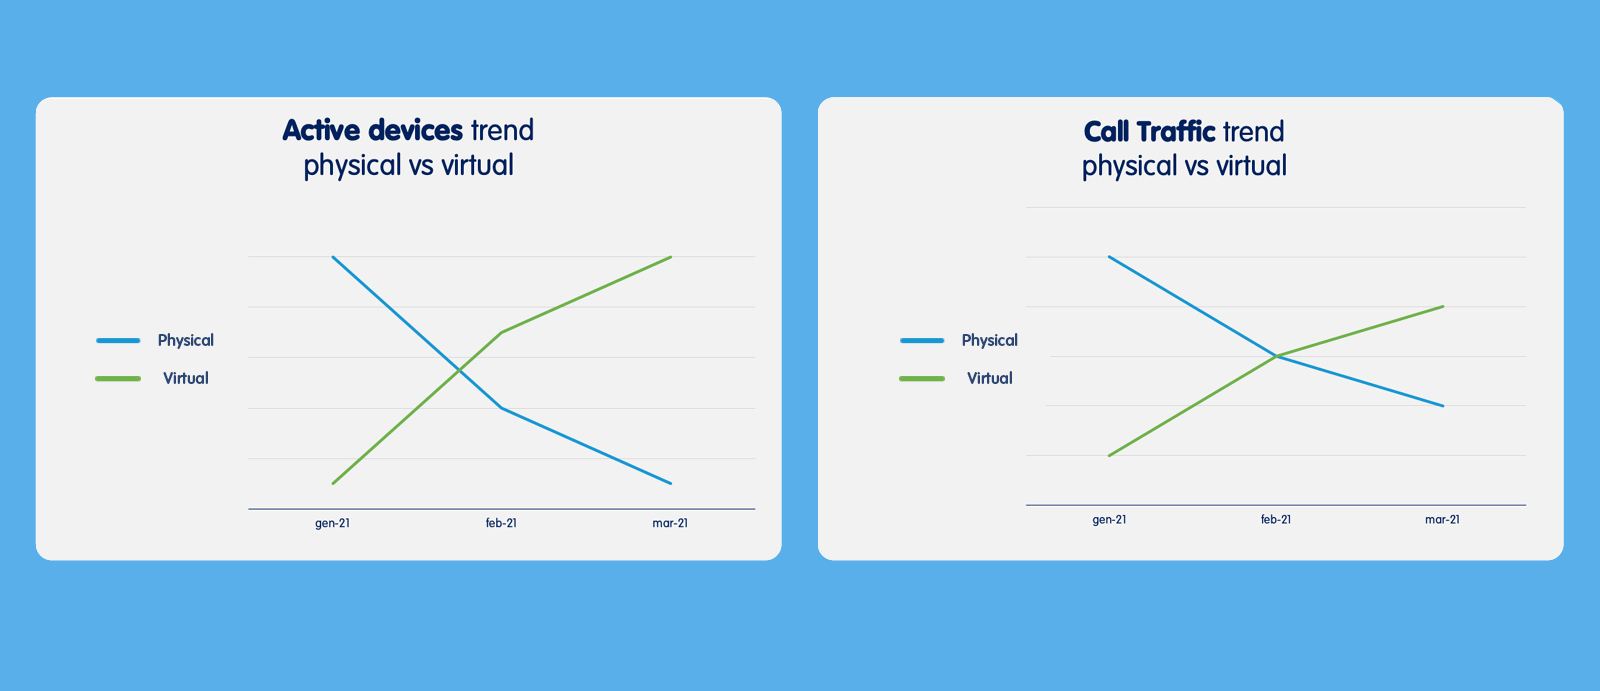
  • Active devices / Call traffic per family (virtual/physical) to track the performance of virtual devices against physical ones and see which direction your company is taking.
Virtual vs. Physical
Last, but not least, we worked to implement and include 2 new fields: device type and name, both for caller and called parties. The reports I’ve described today are prebuilt, but we always give you the possibility to craft and create your own report, following your own needs.
 

Key statistics to grow your business.

Over the past year, the rise of Covid-19 has triggered great technological changes around the world, giving a strong push towards smart working, which although inevitable would certainly have been more diluted over time.
Sudden changes can be frightening on the one hand, but if they are taken in the right way they can also represent an opportunity for the evolution of a company. The important thing is to be ready and to face new challenges with the right tools.
With the introduction of these new reports we hope to have provided valuable tools for those who want to monitor the popularity trends of their company’s communication channels, understand the effectiveness of the organization of devices, optimize resources and increase productivity. We believe that this is just the beginning of a journey to be undertaken together with our users.

Conclusions.

Well folks, the time has come to wrap up. Spring ’21 is at our doorstep, and it brings many flowers with it; some of which have already been introduced by my colleague Simone two weeks ago in this article. Security and accuracy of data like you’ve never seen before! Stay tuned for what’s coming next, because it’s going to be Imagicle! 

0 commenti

Potrebbe interessarti anche...

Resta sempre aggiornato sul mondo Imagicle
Iscriviti alla newsletter per ricevere interessanti contenuti sul mondo delle communications & collaboration.
This site is registered on wpml.org as a development site. Switch to a production site key to remove this banner.